Churn Rate Analysis for Contractors: A Practical Guide

A published benchmark covering more than 85 home-service companies found annual churn ranging from 7% among the best performers to 40% on average and 81% among the weakest operators (Arch). That spread doesn’t tell you that one contractor is automatically healthy and another is doomed. It tells you that contractors are measuring different customers, service cycles, and loss events.
A homeowner who doesn’t book another roof for years hasn’t necessarily churned. A maintenance-plan member who cancels after repeated missed appointments probably has. Your churn rate analysis needs to separate those situations, connect retention to job economics, and show your team who deserves a call before the relationship goes cold.
Table of Contents
- Why a Single Churn Number Misleads Home-Service Contractors
- The Churn Formulas That Actually Match Your Service Line
- Setting Up Your Data Before You Calculate Anything
- Building Cohorts and Segmentation by Service Line, Tenure, and Source
- Statistical Methods and Visualizations Worth Using
- Connecting Churn to Acquisition Economics and Follow-Up Speed
- Your 30-Day Churn Analysis Action Plan
Why a Single Churn Number Misleads Home-Service Contractors
A single annual churn percentage cannot guide operations across HVAC, plumbing, roofing, electrical, and garage-door companies. Two contractors can both report the same churn rate and still have completely different businesses, because one counts maintenance-plan cancellations while the other counts every homeowner who has not called within a year. The first may be tracking a real service failure. The second may be counting normal gaps between jobs.
The denominator determines the story. Are you counting everyone who has ever called, customers active at the start of the period, or customers who bought within a trade-specific window? Are you measuring canceled memberships, unbooked estimates, completed jobs, or revenue lost from existing customers? Each choice answers a different operating question, so combine them in one headline and the report becomes hard to act on.
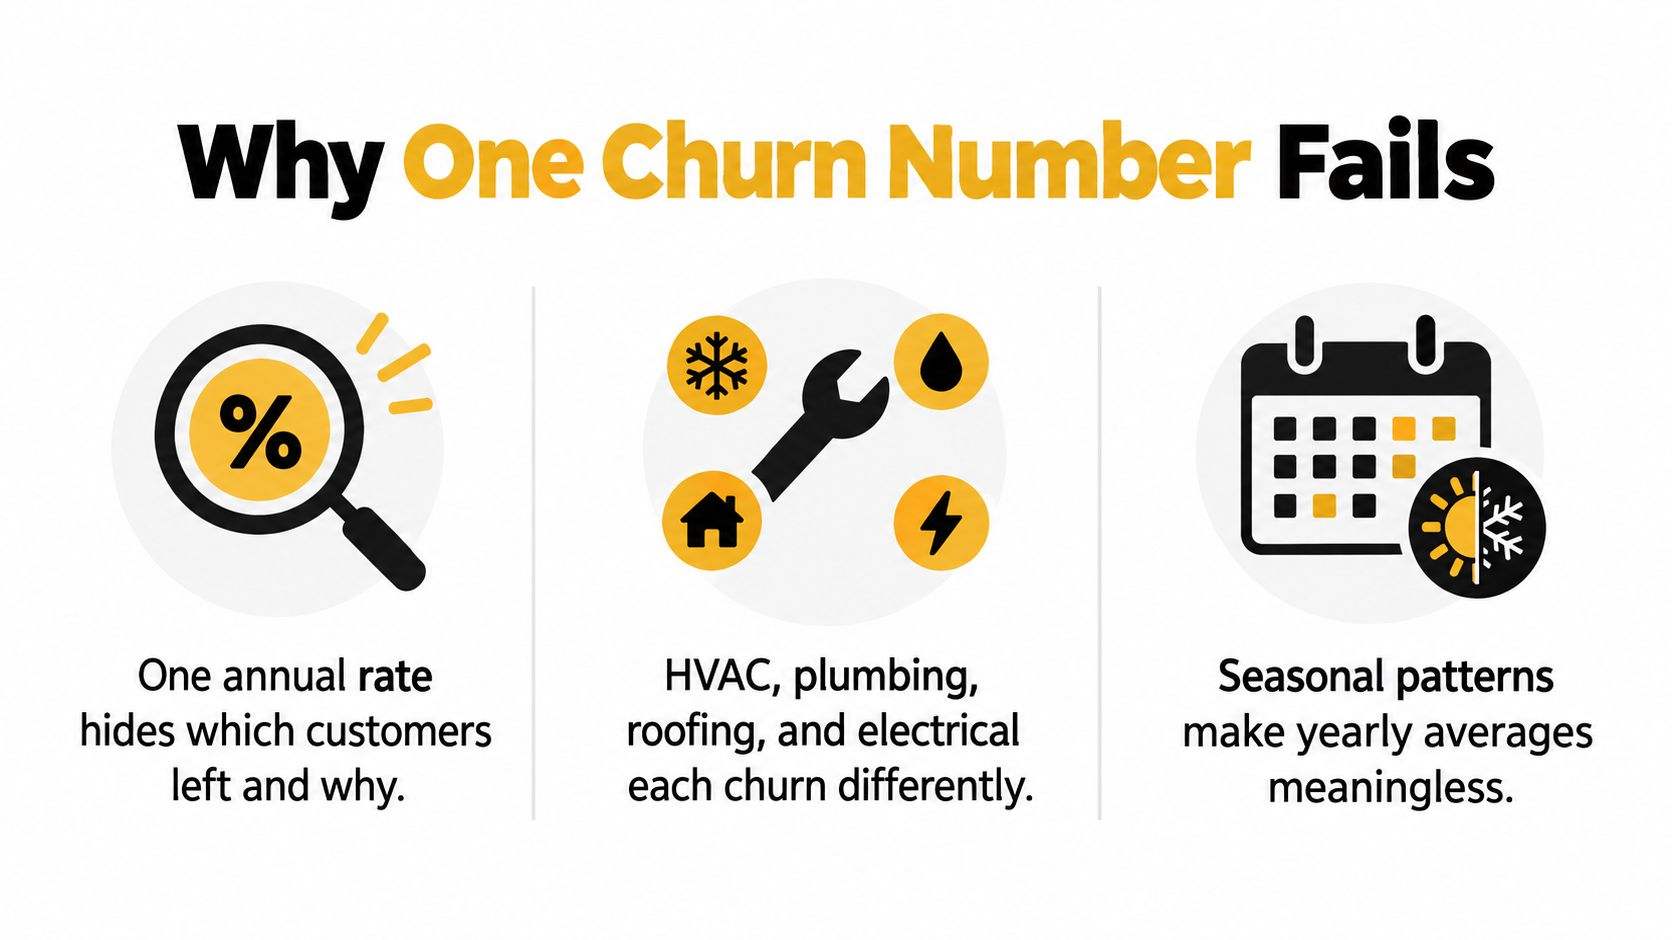
Match the clock to the trade
Your service line sets the period in which inactivity signals risk.
- HVAC maintenance: A missed seasonal tune-up deserves attention because customers usually have a defined service interval.
- Plumbing: Emergency calls, planned repairs, and recurring maintenance produce different repeat patterns. Measure them separately.
- Roofing: A homeowner may not need another replacement for many years. No repeat purchase does not prove defection.
- Electrical: Panel upgrades, rewiring, and small repairs have different reasons and timelines for returning.
- Garage doors: Service calls and replacement decisions follow different intervals. Pair purchase history with follow-up behavior.
Ask one question before labeling anyone churned: did the customer leave, or are they between service occasions? A homeowner who booked a roof replacement and has not returned is not equivalent to a maintenance member who stopped renewing. Treating both as churn wastes office follow-up, distorts retention priorities, and hides the customers your team could realistically recover.
Decide what loss means before reporting it
Write down the customer population, observation window, inactivity or cancellation rule, and denominator before calculating. Choose customers active at the start of the period, average customers, or customer-months for a specific reason, then apply that choice consistently.
Report customer churn beside revenue churn, membership cancellations, and repeat-job loss. A headline rate can summarize performance for leadership, but it should not determine which homeowner your office manager calls on Monday. That decision requires the customer’s trade, last job, expected service interval, and reason for disengagement.
Practical rule: A churn rate earns a place in your report only when a service manager can explain who left, when the loss became visible, and what action could have prevented it.
The Churn Formulas That Actually Match Your Service Line
You need four measures, not one. Each formula answers a different question, and mixing them produces reports that look precise while steering your decisions in the wrong direction.
Customer churn and retention
Customer churn rate is:
Customers lost during the period ÷ customers active at the start of the period
You can express the result as a rate, but keep the underlying counts visible. For a maintenance-plan book, this formula fits canceled memberships or customers who fail to renew under a defined rule. It doesn’t fit a roofing database where a long gap between replacements is normal.
Retention rate is:
Customers retained during the period ÷ customers active at the start of the period
For a recurring service line, retention tells you how much of the starting customer base stayed active. Report it beside churn, not instead of churn. If the two measures don’t reconcile, your customer status rules or source data need attention.
Revenue churn
Revenue churn is:
Recurring revenue lost from existing customers ÷ recurring revenue at the start of the period
This matters when customer value varies widely. Losing a small repair customer and losing a homeowner with a maintenance plan, multiple properties, or repeated commercial-style service needs won’t have the same financial effect. Revenue churn puts the financial weight of those losses into the report.
For one-time-job businesses, use a clearly defined repeat-revenue view rather than pretending every customer produces recurring revenue. Track lost expected contribution from repeat service separately from canceled plan revenue.
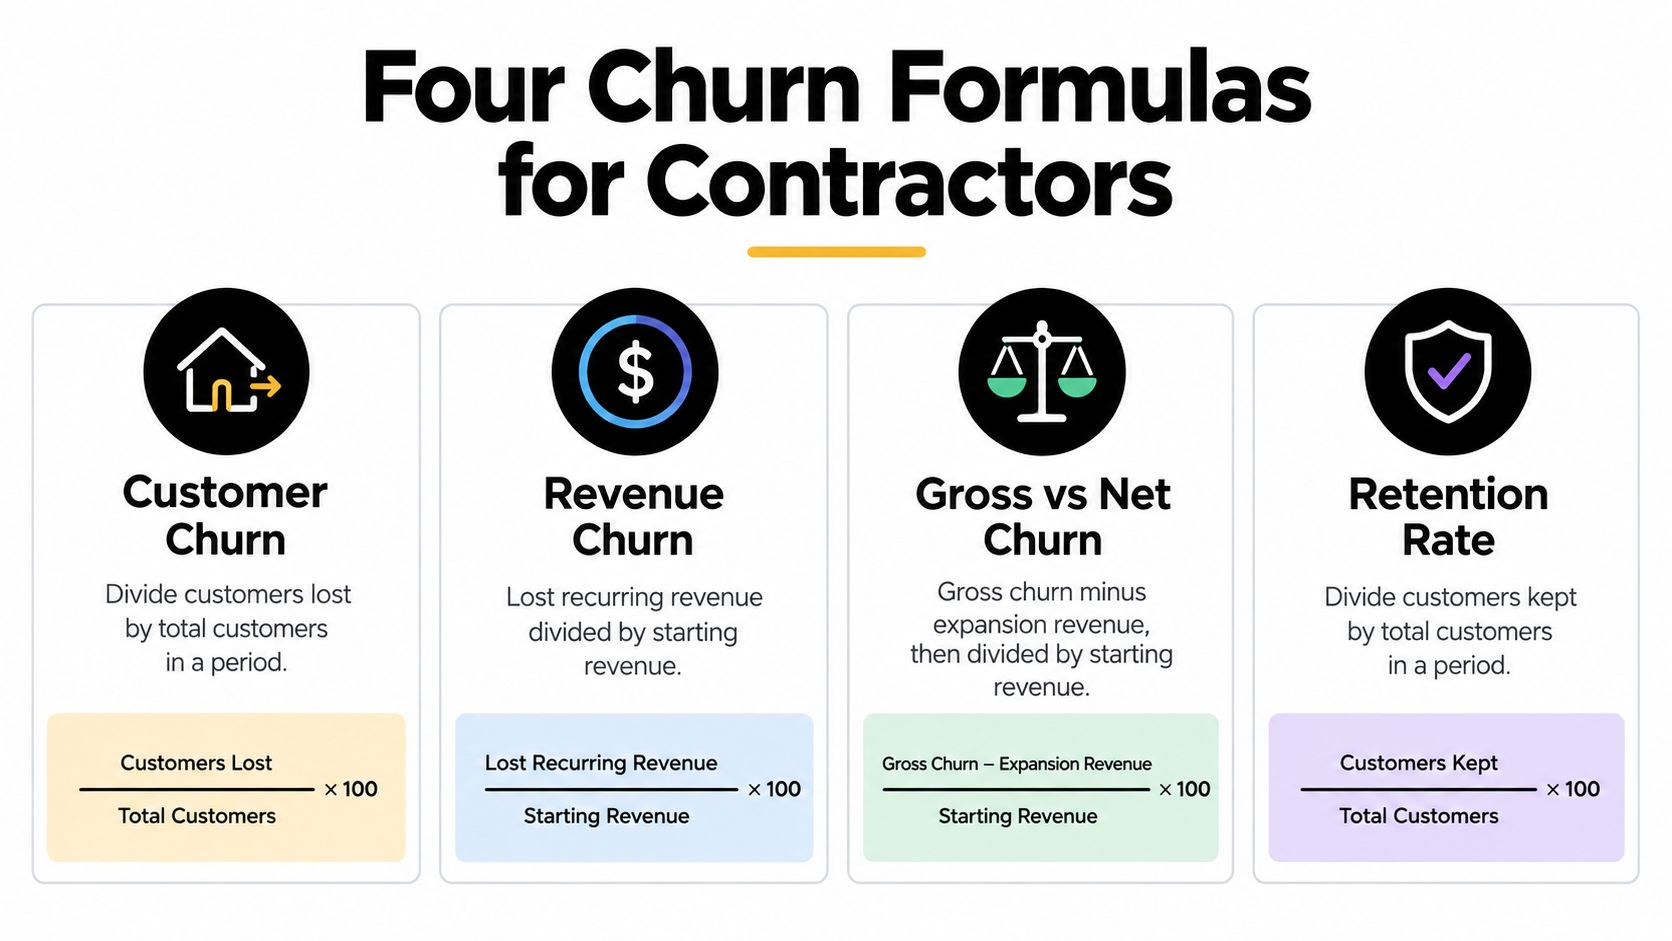
Gross and net churn
Gross churn records losses before expansion. It shows the damage from cancellations, downgrades, or lost repeat work.
Net churn subtracts expansion revenue from existing customers. If a homeowner adds a maintenance plan, books another service, or upgrades work, that expansion offsets some lost revenue in the customer relationship. Use gross churn to diagnose leakage and net churn to understand whether existing relationships are still producing more value overall.
| Measure | Best use | Example |
|---|---|---|
| Customer churn | Count lost customer relationships | Membership cancellations |
| Revenue churn | Weight losses by recurring revenue | Lost plan revenue |
| Gross churn | See pure customer or revenue loss | Canceled service |
| Net churn | Include expansion from existing customers | Added service offsets a downgrade |
| Retention rate | Track customers kept | Renewed memberships |
Choose the denominator that matches the decision. Start-of-period customers work for a fixed monthly membership view. Customer-months can work when service activity changes during the period. Average customers may suit broader operational reporting, but don’t switch denominators from month to month because the resulting trend looks better.
Setting Up Your Data Before You Calculate Anything
Bad source data will give you a clean-looking wrong answer. Pull completed-job history, CRM records, maintenance-plan logs, billing exports, cancellation records, estimate outcomes, and inbound lead attribution before you build the calculation.
Start with a stable customer identity. The same homeowner may appear under a household name in ServiceTitan, a phone number in Housecall Pro, an email address in Jobber, and an invoice contact in QuickBooks. Normalize names, phone numbers, email addresses, property addresses, and account identifiers, then create a crosswalk that shows which records belong together.
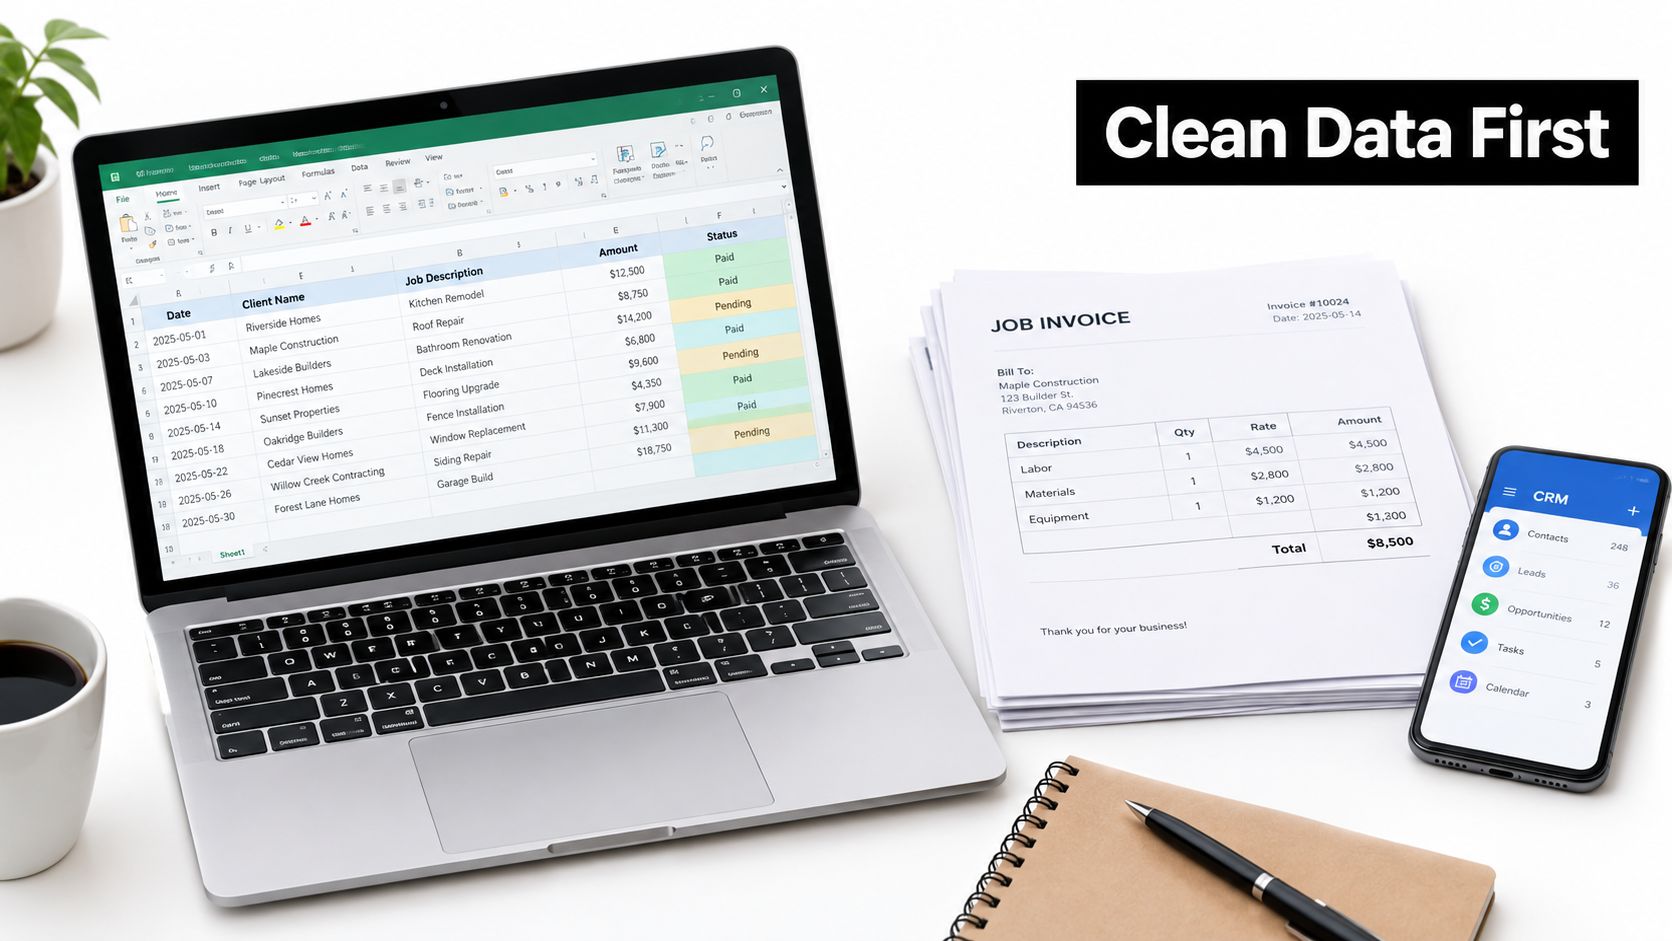
Reconcile the operational record
Your billing system tells you what was charged. Your CRM tells you who was contacted. Your job system tells you what was scheduled and completed. None of those sources should be treated as the complete truth by itself.
Build a reconciliation table with:
- Customer identity: One durable record for the homeowner or property.
- Service event: Estimate, booked job, completed job, cancellation, renewal, or follow-up.
- Service line: HVAC, plumbing, roofing, electrical, garage door, or another category.
- Financial result: Invoice value, refund, discount, and contribution-margin fields where available.
- Acquisition source: Referral, search, paid advertising, direct traffic, or another tracked source.
- Status date: The date the event became operationally meaningful.
Deduplicate before calculating. If one canceled appointment appears as a CRM cancellation and a billing reversal, count one customer event, not two losses. Reconcile monthly totals back to billing or CRM records so your report can survive a manager’s question about why the numbers changed.
Store a snapshot of the rules with every report. Include the population, period, churn event, inactivity window, denominator, and excluded records. A clear audit trail also supports broader business work, including efforts to prove your business is sellable, because buyers need confidence in customer records and revenue continuity.
Prepare data for prediction
If you later build a predictive model, freeze all features at the prediction date. Don’t let a post-cancellation refund, final complaint, or cancellation status enter the feature set. That creates label leakage and makes the model look smarter than it is.
Use a time-based holdout rather than only a random split. Random sampling can put records from the same customer’s lifecycle into training and test data, which gives you an unrealistic view of performance. Keep the data workflow documented alongside your broader data management process.
Building Cohorts and Segmentation by Service Line, Tenure, and Source
Averages hide the customers your team should call. Build monthly acquisition cohorts by grouping homeowners by the month of their first booked or completed job, then track what each group does after that first job.
A January cohort should show repeat-service behavior at 30, 90, and 365 days, with the measurement rule stated beside each figure. Use repeat booking for a one-time service line. Use renewal for a maintenance plan. A completed second job is stronger evidence than a page visit or an estimate request.
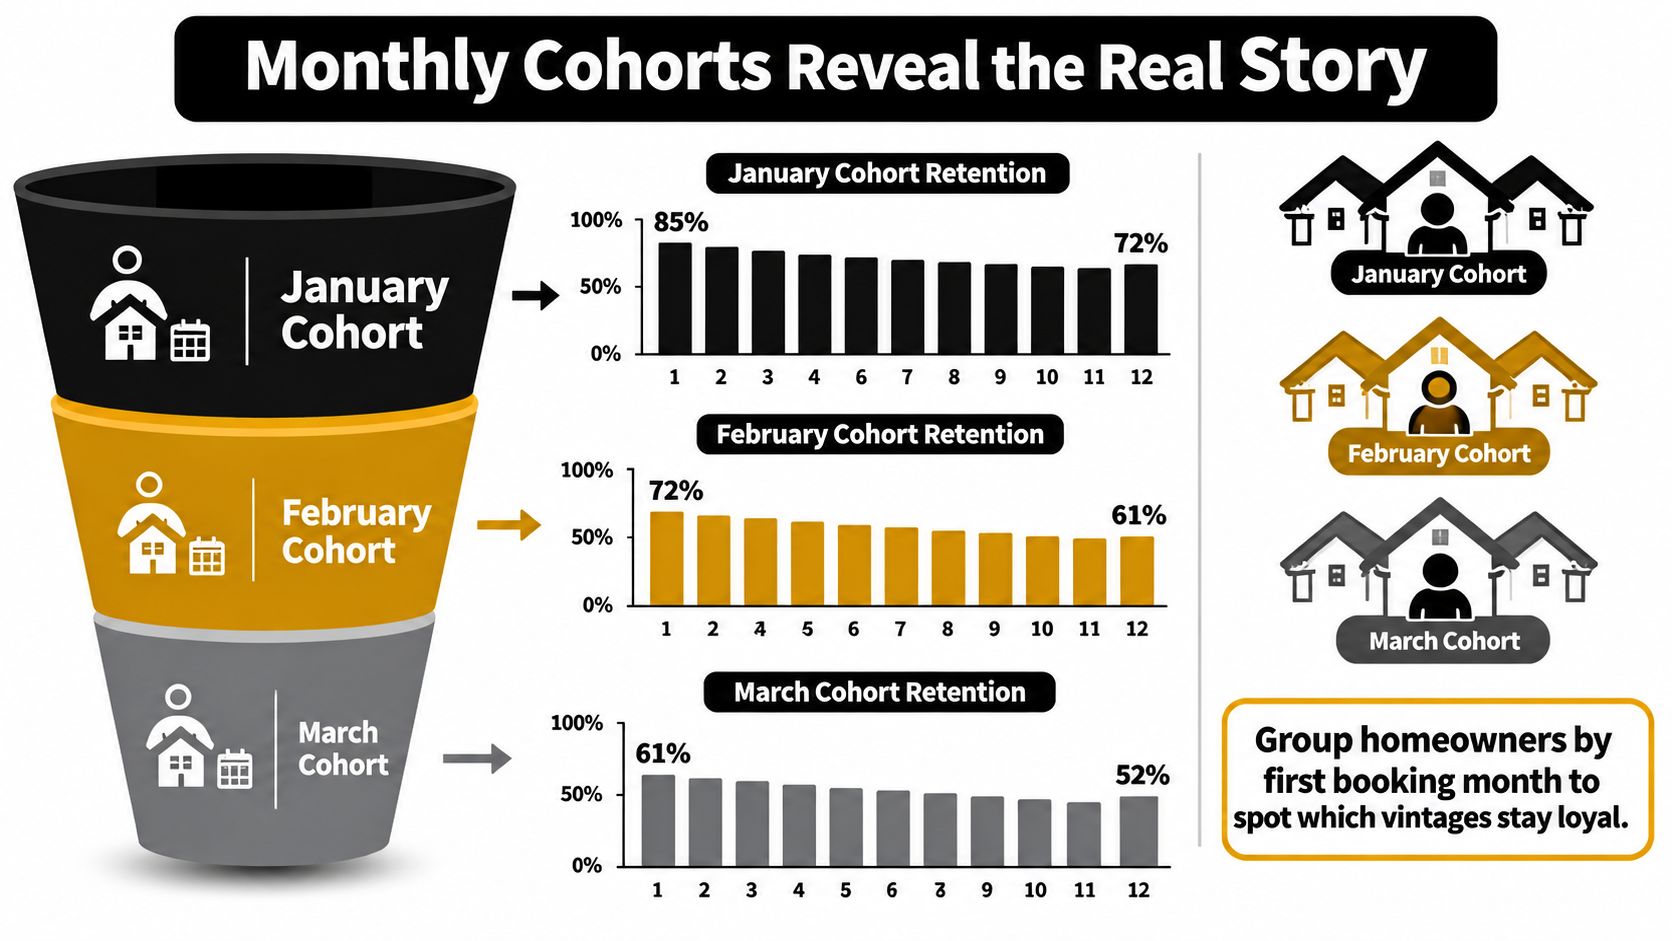
Segment by the reason the customer behaves differently
Service line comes first. HVAC tune-ups, emergency plumbing, roof replacements, and garage-door repairs run on different purchase clocks. Compare each line against its own expected service interval before you combine results.
Tenure shows where customers fall away. Separate first-time customers, recently completed customers, established repeat customers, and maintenance members. Early repeat loss points to estimate handling, scheduling, job quality, or follow-up. Later loss points to renewal timing, competitive pressure, or simple service-cycle differences.
Geography reveals operational patterns. A neighborhood with slow technician response, limited route density, or repeated scheduling issues can produce weaker retention than an otherwise similar area. Map churn and repeat booking by service area, but do not use geography as a substitute for checking the actual job experience.
Acquisition channel connects retention to marketing quality. Compare referrals, organic search, paid search, direct traffic, and other sources using the same cohort rule. A channel that brings cheap leads but weak completed-job retention may be less valuable than a channel with fewer, better-fitting homeowners.
| Segment | What to measure | Action it supports |
|---|---|---|
| Service line | Repeat interval and rebooking | Service-specific reminders |
| Tenure | First-job versus established retention | Onboarding and follow-up changes |
| Geography | Repeat rate by service area | Routing and local operations review |
| Lead source | Completed and repeat jobs by source | Acquisition budget decisions |
| Customer value | Contribution from retained work | Outreach prioritization |
Use cohorts as a forecast
Cohorts turn a backward-looking churn report into an operating forecast. If one lead source produces weak repeat behavior at the first follow-up window, your team can inspect the sales promise, estimate quality, and post-job experience before buying more traffic from that source.
Do not segment for decoration. Every segment needs a different action, owner, and review date. If two segments receive the same message, same offer, and same follow-up, combining them may produce a clearer report.
Statistical Methods and Visualizations Worth Using
A line chart of monthly churn is a starting point, not an analysis. Your dashboard should show when customers leave, which segments carry the risk, whether a predicted score is trustworthy, and whether an intervention creates incremental profit.
Test ranking and calibration separately
ROC-AUC measures how well a model ranks higher-risk customers above lower-risk customers. Calibration asks a different question: when the model assigns a customer a 30% risk, do customers in that group churn at approximately 30%?
A published benchmark reported a neural model with 0.864 ROC-AUC, 0.821 precision, 0.418 recall, and 0.553 F1 (Scientific Reports). That combination shows why accuracy alone is a poor management metric. The model ranked customers reasonably well, but it missed many actual churners.
Another published telecom framework used a stratified 70/30 split and 10-fold cross-validation, yet its churn recall was only 0.68 despite 0.98 precision (PMC). In practical terms, the model missed roughly 32% of actual churners. For a contractor, those misses may include a high-value homeowner or contractor account that needed one timely follow-up.
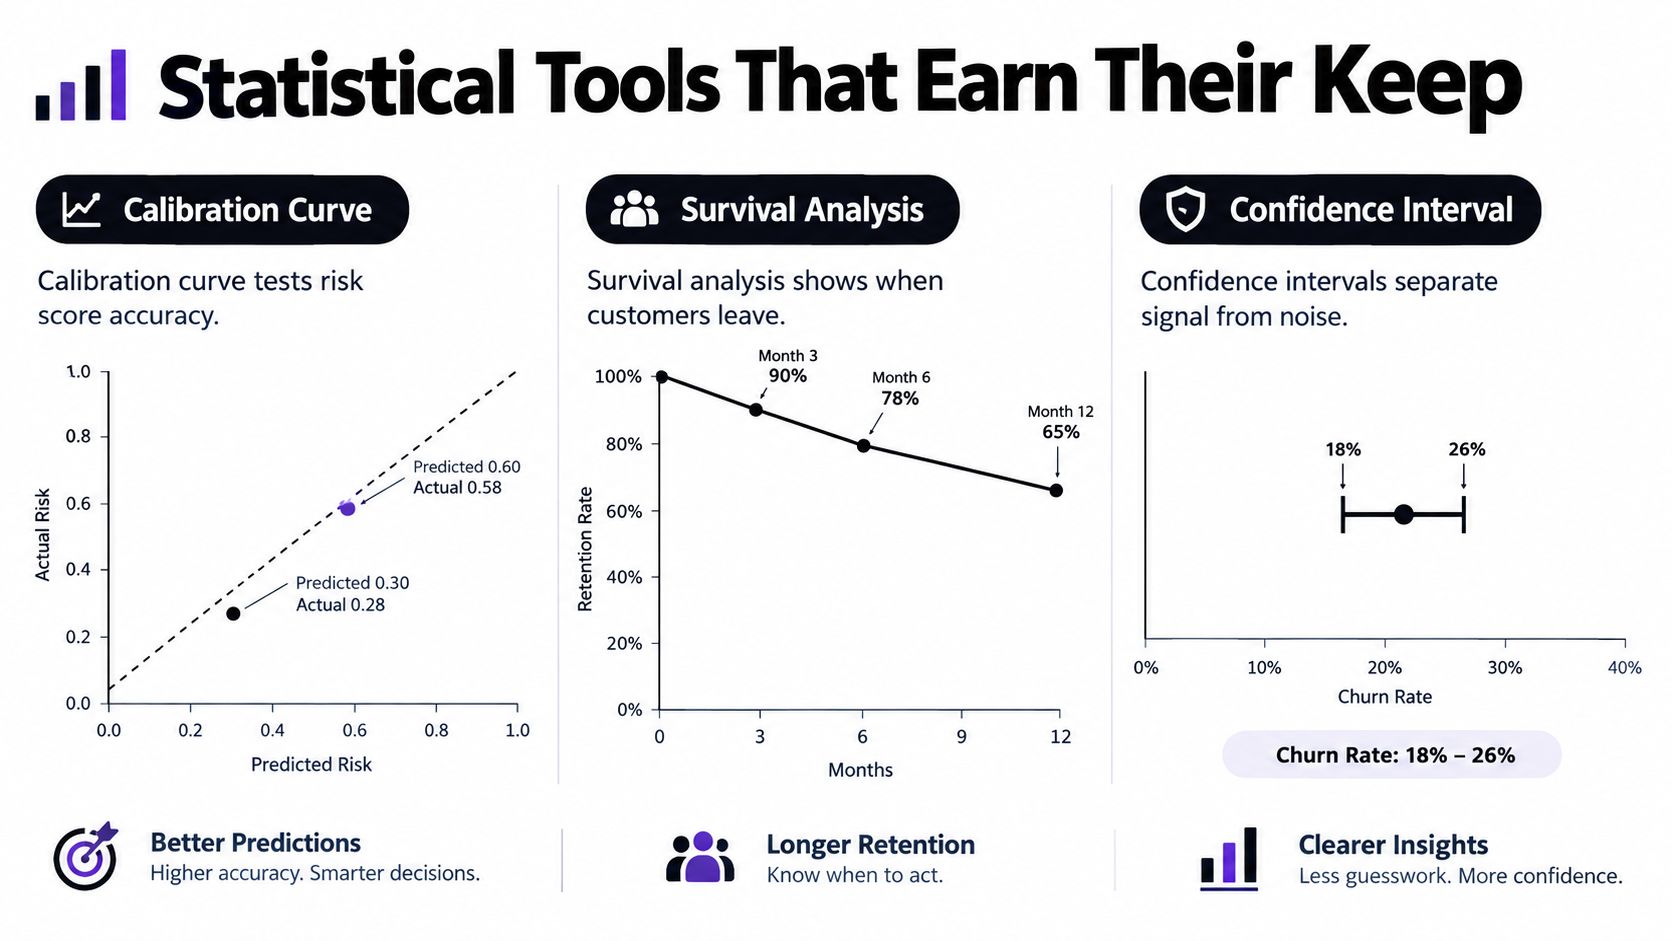
Build visuals your service manager can use
Use a calibration curve to compare predicted risk with observed churn. Apply isotonic regression or Platt scaling on an untouched validation set, then inspect the reliability curve and Brier score. Recheck calibration after major changes in traffic mix, seasonality, pricing, or CRM workflows.
Use survival curves to show when customers stop returning. This is useful for service lines with irregular intervals because the curve can distinguish early repeat loss from normal long-cycle inactivity.
Use heatmaps to show churn by service line and tenure. Use cohort retention curves to compare acquisition months. Add confidence intervals to observed churn so managers don’t mistake a small-sample fluctuation for a real operational shift.
Use profit, not model pride: Set alert thresholds by comparing expected recovered gross margin with contact, discount, and labor costs. Track false negatives separately because missed at-risk customers can cost more than extra alerts.
Run rolling backtests across multiple time periods. Compare performance before and after a slow season, price change, service-area expansion, or CRM migration. Measure contacted customers against a randomized holdout where possible. Customers who receive outreach often differ from customers who don’t, so lower observed churn among contacted homeowners doesn’t prove the outreach caused the improvement.
For a broader reporting setup, connect these visuals to web analytics and reporting so site behavior, lead activity, and completed-job outcomes can be reviewed together. For owners evaluating recurring revenue quality, The Owner’s Shortlist’s guide to recurring revenue provides useful context for understanding why predictable customer relationships matter in business valuation.
Connecting Churn to Acquisition Economics and Follow-Up Speed
Retention and revenue growth ranked as the top business goals in a 2025 survey of more than 1,000 residential contractors, ahead of acquiring new customers (ServiceTitan). Your budget should reflect that priority, but only after you know which retained customers produce worthwhile margin.
Calculate the economics of recovery for each intervention. Compare expected recovered gross margin with contact cost, labor time, discount cost, postcard expense, and any technician follow-up required. A retention campaign that lowers cancellations while consuming the contribution from every recovered job is a bad campaign.
Watch for intent before the loss
Useful signals appear in the recoverable funnel:
- An estimate request went unanswered.
- A homeowner missed an appointment.
- A post-job rating dropped.
- A maintenance renewal lapsed.
- A past customer revisited a service page without submitting a form.
- The interval since the last completed job became unusually long for that service line.
These signals need context. A returning visitor looking at an emergency plumbing page deserves a different response from a roofing customer browsing educational content years after a completed replacement. Combine intent with service history, customer value, geography, and operational friction.
Pipeline On can identify anonymous site visitors and connect contactable profiles to tools such as ServiceTitan, Housecall Pro, Jobber, HubSpot, and Pipedrive, where permitted by your processes and data practices. That makes website revisits one possible input to an early-warning workflow, alongside CRM and job-history signals.
Rank customers by recoverable margin
Use customer lifetime value to rank the opportunity, then add observable intent. A high-value homeowner who revisits a service page after an unresolved estimate deserves attention before a low-margin customer with no sign of future need. Your customer lifetime value analysis should include retained contribution margin, not just booked revenue.
A contractor serving Mesa, for example, might pair seasonal maintenance reminders with clear education about AC service in Mesa, but the outreach still needs to match the customer’s service history and likely timing. Blanket discounts are a lazy substitute for diagnosis.
Measure each channel separately, including phone, SMS, email, postcard, and technician follow-up. Compare the incremental result against a holdout, then keep the play that produces profitable retained work. Lower churn isn’t automatically better when the campaign targets customers who have little propensity to return or little margin to protect.
Your 30-Day Churn Analysis Action Plan
Start Monday with one service line. Choose the churn event, observation window, customer population, and denominator. Export job, CRM, plan, billing, and lead-source records, then reconcile duplicates before anyone reports a rate.
During the second week, build monthly acquisition cohorts. Calculate 30-day, 90-day, and 365-day repeat-service or renewal rates using the rule that fits the service line. Segment by service, tenure, geography, acquisition channel, and customer value.
In week three, rank intervention opportunities. Estimate recovered gross margin for each segment, subtract outreach and labor costs, and assign one owner to each play. A plumbing company might prioritize established homeowners in high-value neighborhoods who recently revisited a service page after a missed estimate. The office can test a postcard and SMS sequence, but it must record eligibility, contact, response, completed job, and margin.
Week four is measurement. Lock the baseline, choose alert thresholds from outreach economics, and keep a holdout group. Review false negatives, false positives, and actual retained contribution. Recheck the data after the next reporting period, then investigate any change in service mix, seasonality, routing, pricing, or CRM status rules before declaring victory.
The operating standard: Every churn alert needs a defined customer, a reason for the alert, an assigned action, a cost ceiling, and a measured outcome.
Don’t wait for a complex model. A defensible definition, clean cohorts, and fast follow-up will outperform an impressive score that your team can’t interpret or act on.
Pipeline On helps home-service contractors connect anonymous website visits with recoverable customer and lead activity, then route follow-up through the tools and channels your team already uses. Visit Pipeline On to see how its lead identification and conversion workflows can support your churn rate analysis and retention follow-up.
Written by
Pipeline Research Team